

A product often starts with one screen, one database, and a few integrations. Three months later, the same project may include background jobs, payment logic, authentication, analytics, and several services that only one founder fully understands. At that point, explaining the system from memory becomes slow and risky. A lightweight diagramming habit helps. Tools such as OnUML let builders turn a written description into an editable technical diagram, making architecture easier to review before more code is added or an important technical decision becomes expensive to reverse.
Why Solo Builders Delay Diagrams
Many indie hackers avoid diagrams because they associate them with enterprise meetings, formal documentation, or hours spent arranging boxes. Early in a product, that reaction feels reasonable. The code is small, the founder remembers every decision, and shipping appears more valuable than documenting.
The problem arrives gradually. A webhook triggers a worker, the worker updates a table, and another process sends an email. None of those steps is difficult alone. The difficulty comes from remembering how they interact when a bug appears two months later.
A useful diagram does not need to document every class or endpoint. Its first job is simpler: show the parts that affect important product behavior. For a subscription app, that might mean the user, checkout page, payment provider, webhook handler, database, and account access logic. The finished picture should help you explain the flow in under two minutes.
Choose One Question Before Drawing
The fastest way to create a useless diagram is to start with “show the whole system.” That request produces too much detail and no clear reading path. Instead, choose one question the diagram should answer.
For example, a founder investigating failed upgrades might ask, “What happens after a customer completes payment?” A founder planning a mobile app might ask, “Which parts of the current web backend can the app reuse?” A founder onboarding a contractor might ask, “Where does user data enter, change, and leave the product?”
Each question suggests a different diagram. A sequence diagram works well for events that happen over time. A component or architecture diagram shows services and dependencies. A flowchart explains decisions, branches, and fallback paths.
Keeping the question narrow also makes mistakes easier to spot. When the diagram has one purpose, you can quickly notice a missing webhook, unclear ownership, or a dependency that should not exist.
Build a Useful First Draft in Three Passes
A good first version should be understandable, not polished. Indie founders get more value from a rough diagram they update than from a perfect diagram they avoid touching. Use three short passes.
- List the Actors and Systems
Write down only the people and systems involved in the chosen question. For a signup flow, the list might include a visitor, the application, an authentication service, the database, and an email provider.
Do not add every internal module. Start with items that send information, receive information, or make a decision. This gives the diagram a clean boundary and prevents unrelated features from taking over the page.
- Describe the Important Actions
Next, describe what moves between those parts. Use plain statements such as “the app creates a pending account,” “the authentication service returns a user ID,” or “the email provider sends a verification link.”
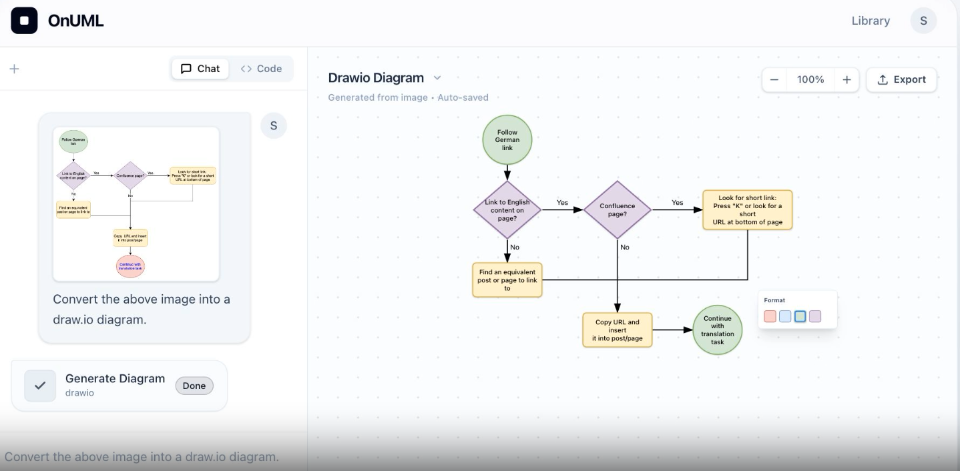
This is where an AI UML Diagram Generator is useful. OnUML supports generating diagrams from natural-language descriptions in Mermaid, PlantUML, or Draw.io workflows. The first result is not the final design; it is a structured draft that gives you something concrete to inspect and edit.
- Remove Detail That Does Not Change Decisions
Review every box and arrow. Ask whether removing it would make the answer less clear. If not, remove it.
A diagram for a product decision rarely needs method names, minor database fields, or every error response. Keep details that reveal ownership, sequence, data movement, or failure points. You can always create a second diagram for implementation details after the high-level flow is understood.
Match the Diagram Style to the Work
Different diagram styles support different habits. Choosing the wrong one creates friction, especially when a small team needs to update the diagram later.
Mermaid is practical when the diagram belongs near Markdown documentation. Its text-based format makes small edits easy and keeps the source readable alongside technical notes. A founder documenting deployment steps or a user journey can change the diagram without manually moving every shape.
PlantUML fits more formal technical modeling. It is useful when the product needs class, sequence, component, deployment, or C4-style diagrams with more structure. A developer planning a service split may prefer this approach because relationships can be expressed precisely in text.
Draw.io is better when direct visual control matters. It suits architecture reviews, planning sessions, and diagrams shared with people who prefer dragging, connecting, and resizing shapes. OnUML places these modes in one workspace, so the choice can follow the task instead of forcing every diagram into one format.
Use Diagrams at Decision Points, Not Everywhere
Diagramming becomes sustainable when it is tied to specific decisions. Trying to diagram every feature will create another neglected documentation project. Instead, add a diagram when the cost of misunderstanding is rising.
Before building a major integration, map the external service, incoming events, retries, stored data, and failure behavior. Before separating a monolith, show current responsibilities and the proposed service boundary. Before hiring a contractor, create one diagram that explains the core request flow they will touch.
Diagrams also help during debugging. Suppose customers report that paid accounts remain locked. A sequence diagram of checkout, webhook delivery, verification, database update, and access checks gives the investigation an order. The founder can mark where the expected state stops matching reality.
The result is not simply better documentation. It is a faster conversation with yourself, a collaborator, or an AI coding assistant because the system has been reduced to visible parts and relationships.
Keep the Diagram Connected to Reality
The main weakness of architecture diagrams is not poor design. It is age. A clear diagram becomes misleading when the product changes and the file stays untouched.
Reduce that risk by giving each diagram a narrow title and a visible purpose. “Payment upgrade sequence” is easier to maintain than “Complete platform architecture.” Store the diagram near the decision, issue, or technical note it supports. When a related change ships, update or retire it.
Text-based diagrams are especially useful when frequent revision matters, while visual editing works well for discussions where layout communicates priority or grouping. OnUML also provides live rendering, code repair for Mermaid and PlantUML, and export options, which helps move from a rough description to a shareable result without rebuilding the diagram elsewhere.
Most importantly, treat the diagram as a working explanation rather than a permanent truth. Its value comes from helping someone make the next decision accurately.
Conclusion
Indie products rarely become complicated in one dramatic moment. Complexity grows through small features, integrations, and exceptions that remain manageable until they suddenly are not. A focused diagram gives founders a practical way to keep that growth visible. Start with one important workflow, include only the systems that affect it, and choose a format you will actually maintain. Before your next feature crosses several services, take a few minutes to map the flow and turn hidden complexity into something you can review, explain, and improve.